5.1. Modeling aspects
5.1.1. Measured signals
The signals that may be measured are dependent of the location to which the sensor is attached. In general, pressure type quantities are defined in H-nodes, whereas flow type quantities are defined within (entry and exit) of components. Furthermore, it is possible to measure certain component specific quantities such as pump speed, pump status (running, off), valve position, etceteras.
An overview of the measurable quantities is given in the table below:
Hydraulic object |
Measured variables |
H-node |
H, P |
Pipe |
Q, v (only at begin or end of Pipe) |
Fall type |
Q, DH, DP, component specific output |
Supplier type |
Q, component specific output |
in which:
H |
= |
pressure head |
[m] |
P |
= |
pressure |
[Pa] |
Q |
= |
discharge |
[m3/s] |
v |
= |
velocity |
[m/s] |
DH |
= |
pressure head difference |
[m] |
DP |
= |
pressure difference |
[Pa] |
The component specific quantities are the same as the component specific output described at the H-component definitions
5.1.2. Controlled hydraulic components
In the table below the controllable H-components are listed, together with their manipulated variable.
H-component |
property remark |
Type of input signals |
Manipulated variable |
BOUNDH |
- |
numerical |
Pressure head [m] |
BOUNDQ |
- |
numerical |
Discharge [m3/s] |
FCV |
- |
numerical |
setpoint |
PdCV |
- |
numerical |
setpoint |
PuCV |
- |
numerical |
setpoint |
PUMP |
Drive type =running Drive type =trip Drive type = speed Drive type = motorfreq |
numerical Both numerical numerical |
Pump speed [rad/s] Run (T), Trip (F)*); Pump speed [rad/s] Pump speed [rad/s] Relative frequency [-] |
PUMPSS |
numerical |
Motor speed [rad/s] |
|
VALVE |
both |
Valve position [-] **) |
(*) One way only
(**)The valve can be connected to both a numerical signal line and a logical signal line. The logical signal line will enable/disable the control of the valve depending on its value: TRUE/FALSE. If the control is disabled the valve will maintain its last control value.
If both an action table and a control table are connected/defined, the control table will prevail.
Hence in steady state the hydraulic system as well as the control system must be in balance, a message is given if the initial hydraulic steady state value of the controllable H-component differs to much from the control value.
5.1.3. Data flow Unsteady
For every time step the control system is evaluated after the hydraulic solution has been obtained. The consequence of this is that the output signals of the control system are synchronous with the hydraulic solution. At the beginning of the next time step all hydraulic components which are connected to actuated signal lines will process the signals. This implies that the actuation has a delay of one time step. This is an explicit approach in contrary of an implicit approach in which an integrated solution of hydraulic and control variables would be obtained (at the cost of substantially more modelling of the control components physics).
5.1.4. Control Diagram aspects
While entering the control system the user is bound by the following rules:
- Combined control relations can be constructed using:- arithmetic operator blocks (for numeric values): ‘+’, ‘-’, ‘*’ and ‘/’.- logical operator blocks (for logical values): ‘AND’, ‘OR’, ‘NOT’ and ‘XOR’.
The commutative operators ‘+’, ‘*’, ‘AND’ and ‘OR’ have one input channel to which many signal lines may be connected. The non-commutative operators ‘-’ and ‘/’ have two input channels, the first for the left part (a) of the expression, the second for the right part (b) of the expressions a-b and a/b. The ‘NOT’ operator is unary, that is it has only one input signal. The ‘XOR’ operator has one input channel at which exactly two logical signal lines must be connected.
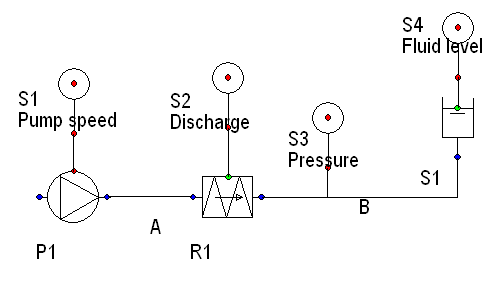
Sensors can be connected to the hydraulic diagram in several ways:
Examples are given in the figure below. Measured are: pump speed (sensor S1), discharge through resistance (sensor S2), pressure in H-node (sensor S3) and level of surge tower (sensor S4).
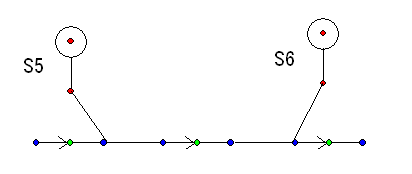
For pipes only the flow values Q and v at the first and last pipe-nodes can be measured. The sensor must be placed at the hydraulic connect points (the blue ones) of the pipe. Examples of sensor placement are given in the figure below:
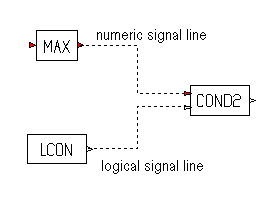
C-components can be placed freely in the diagram. While the box contains the class annotation the shape can not be flipped (only rotated)
The maximum numbers of signal lines allowed to be connected to the input and output channels are defined in the particular class description: the C-component descriptions. In general, the number of connections to output channels is unlimited.
Signal lines can only connect output and input channels of the same type (logical to logical and numeric to numeric).
The unit dimension of the value measured by the sensor is always in SI-units. Changing the unit mode has no affect on the Control scheme.
When a logical input channel is not connected to a signal line the default value taken by the C-component procedure will be TRUE. A numeric input channel must always be connected to at least one signal line.
The measured quantity of a SENSOR is initially undefined, which is indicated by a “?”.
When the unit dimensions of two signal lines connected to the same input channel do not match, a warning is issued, but the connection is accepted. This is due to the fact that the user yet has to specify some of the measured quantities. At the final check of the control system the unit dimension must be of the same type.
When a C-component is deleted, all connected signal lines are removed as well. Deletion of a signal line has no consequences. Changing of the type of an H-component, will not result in the deletion of the connected signal line. It is possible that the connected C-component or signal line become invalid due to this changing if the definition of the former one doesn’t match the definition of the latter one.
5.1.5. Control Output properties
After completion of the computation time history plots of the output signals of all C-components can be made. The unit dimension will always be “dimensionless”: [-]. It is the user’s responsibility to select signals for multi-line charts such that the ranges of the selected signals are of the same order of magnitude.
A very interesting opportunity is the possibility to use C-components and signal lines to combine hydraulic output and generate derived signals. For instance one can make a time history plot of the sum of two discharges or the difference between two pressures.
It is therefore well conceivable that the user enters a control system in which not all output channels are connected to signal lines.